Excess emissions from industrial facilities: What are they and why should we care about them?
Download as PDF
Nikos Zirogiannis, A.J. Hollingsworth, and D.M. Konisky
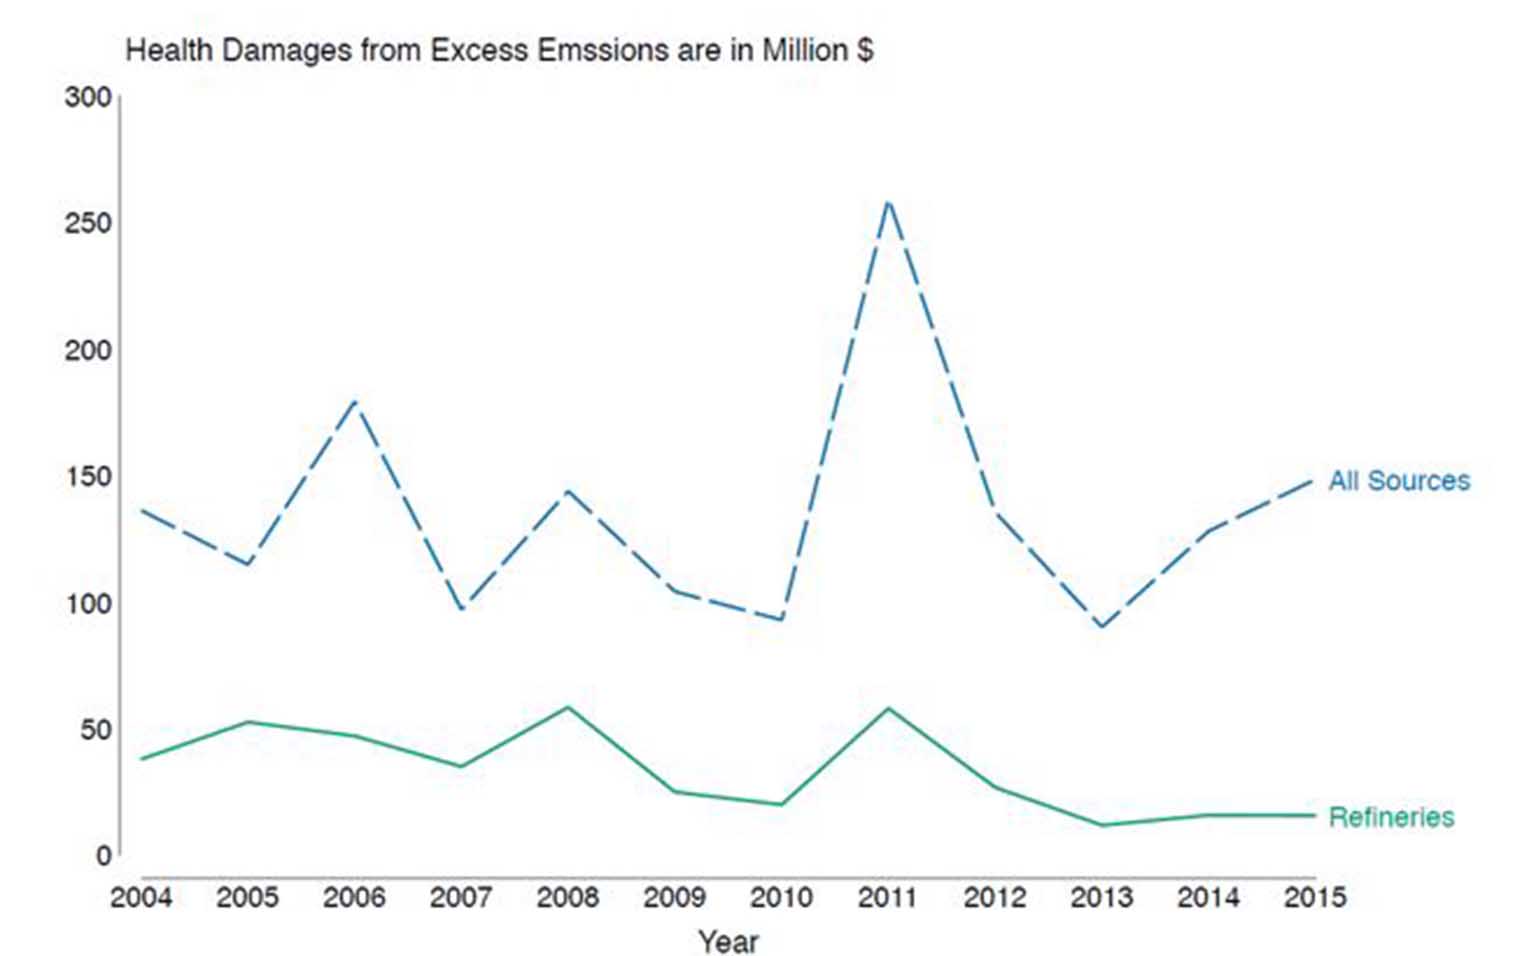
Excess emissions are a specific class of emissions released during periods of startups, shutdowns or malfunctions (SSM) from industrial facilities. For decades, excess emissions have remained outside of the regulatory and enforcement focus of the EPA. In a recently published paper at the Journal of Environmental Science and Technology, we analyzed a unique dataset of excess emissions from industrial facilities in Texas. Our findings suggest that these pollution releases occur on a regular basis and are large enough to represent a sizeable share of permitted emissions. Using an Integrated Assessment Model, we estimated that the health impacts of excess emissions are approximately $150 million per year in Texas.
Background
Excess emissions due to SSM that go beyond a facility’s permitted levels have been considered violations of the Clean Air Act (CAA) since the law was enacted. While states have always been required to regulate these releases in their State Implementation Plans (SIPs), they have for years regularly granted automatic exemptions to facilities with excess emissions. Even though there have been several court decisions with regards to SSM requirements over the years, a great deal of uncertainty and inconsistency across states exists as to how excess emissions are regulated. In 2015 the EPA identified 36 states whose SIPs included language that was inadequate to meet the standards of the CAA with regards to how excess emissions were treated. States have begun to revise their SIPs, but the new EPA administration has signaled that it might consider withdrawing the 2015 SIP call.
The problematic regulatory landscape of excess emissions described above, is compounded by the fact that few states keep systematic records of excess emissions events and even fewer make that data available to the public in a comprehensive manner. Texas, Louisiana and Oklahoma are the only three states that have developed comprehensive reporting requirements for excess emissions and make the information publicly available. Other states that collect data on excess emissions and make them available to the public do so on a case-by-case basis. For practical purposes, that makes analyzing the information on excess emissions very challenging.
Since 2003 the Texas Commission on Environmental Quality (TCEQ), has implemented a 24-hour reporting requirement. Any facility in the state that experiences an excess emissions event (where emissions cross a certain threshold) has 24 hours to report that event to the TCEQ. The facility is then given two weeks to submit a final report that, if necessary, will provided updated/corrected information about the types and amounts of pollutants that were released.
Key Findings
Studying data from the Texas Emissions Inventory as well as the Air Emissions and Maintenance Events dataset (described above) over the period of 2003-2017 we arrived at the following key findings.
Excess vs. Permitted Emissions
The magnitude of excess emissions is sizeable especially when compared to permitted emissions. Across all facilities, excess emissions of Volatile Organic Compounds (VOCs) represented 7.5% of permitted emissions in the time period 2004-2015. The relevant ratio for other criteria pollutants is 2% (sulfur dioxide and carbon monoxide), 1.5% (for particular matter 10 and 2.5), and 0.5% (nitrogen oxides). Among the group of VOCs several pollutants had significantly high ratios of excess over permitted emissions. Examples include N Butane (22%), propylene (20%), ethylene (14%), and benzene (5.5%).
Key Industrial Sectors
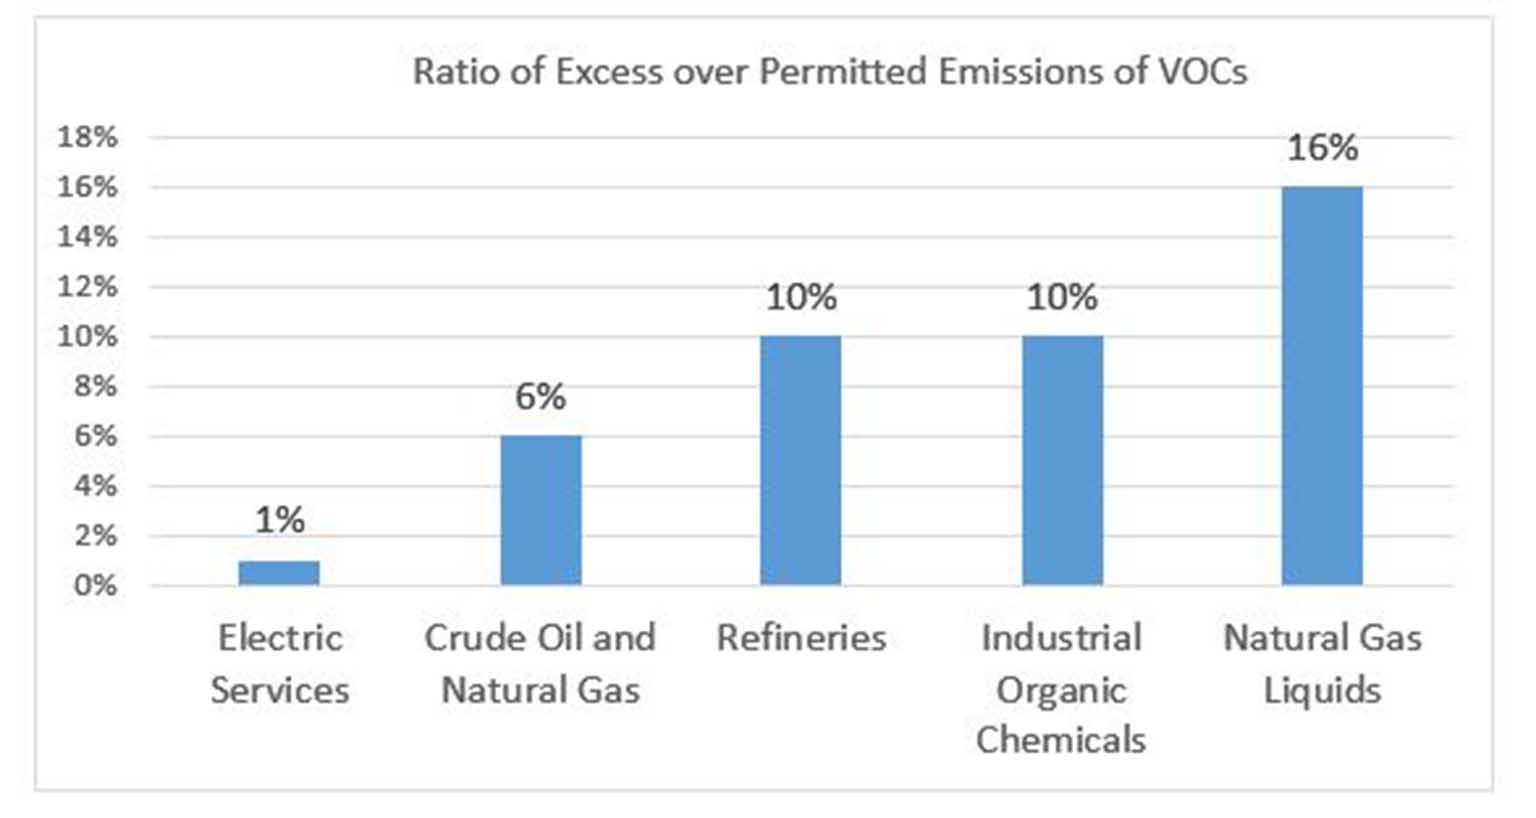
A small number of industrial sectors, emit the vast majority of excess emissions. The top five sectors—Natural Gas Liquids, Refineries, Industrial Organic Chemicals, Electric Services, Crude Oil and Natural Gas—emit upwards of 80% of excess emissions of all industrial sectors in Texas. Moreover, the ratio of excess to permitted emissions for those sectors can be substantial. Figure 1 shows the ratio of excess to permitted emissions of VOCs for the top polluting sectors.


