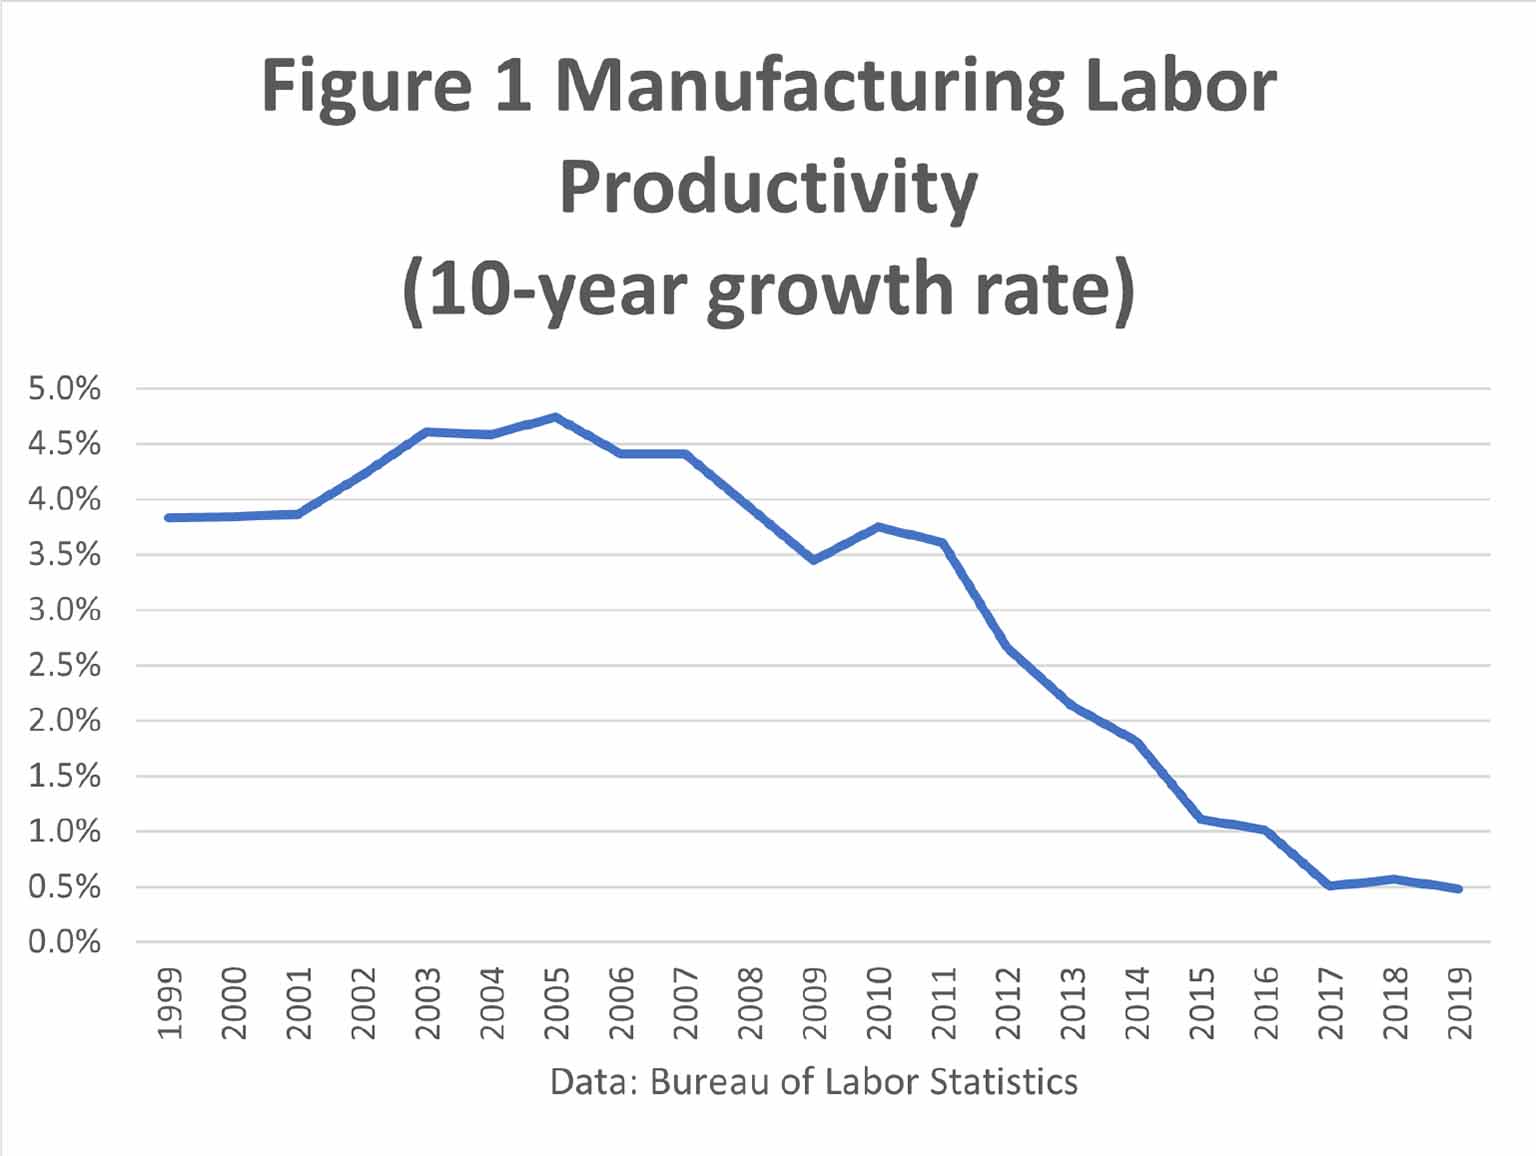
According to the government’s official figures, virtually every corner of domestic manufacturing was affected by the productivity slowdown, from food production to machinery to plastic products to computers (Table 1). In many manufacturing industries, productivity has actually fallen in recent years. For example, from 2009 to 2019 labor productivity in the medical equipment and supplies industry declined by 3%, which may help explain some of the U.S. struggles with the pandemic.
The slowdown in manufacturing productivity growth may also help explain why the non-oil goods trade deficit hit a record $839 billion, up from $825 billion in 2018. While in theory there is no necessary connection between weak productivity growth and a growing trade deficit, it’s not what one would have expected from a vibrant manufacturing sector.
The weakness in productivity growth is also supported by the low rate of capital investment in manufacturing. The BLS measure of manufacturing “capital intensity”—reflecting the amount of capital per labor hour—has risen by only 4 percent since 2009, well below its historic long-term trend.
Moreover, the evidence suggests that many domestic manufacturers have been digitizing slower than expected, an essential component of global competitiveness. In our July 2020 Insight into Manufacturing Policy, we look at current patterns of hiring in manufacturing and conclude that “domestic manufacturers are not shifting toward digital jobs in response to the pandemic.”
In this note, however, we examine the other side of the argument. Taking seriously the old maxim that “the map is not the territory,” we identify several reasons why the pessimistic government figures may be missing some of the gains in manufacturing:
Quality and variety improvements. In a few industries, such as computers and semiconductors, government statisticians adjust factory output for changes in quality. This is known as “hedonic pricing.”
However, in most industries the BLS does not adjust for quality changes, which may come in many different forms. For example, measured productivity in the food manufacturing industry fell by 5.8% from 2009 to 2019. That’s a very poor performance which ends up raising food prices for consumers.
But this decline coincided with the enactment and implementation of the FDA Food Safety Modernization Act, signed into law in early 2011. This act required food manufacturers to devote more resources to reducing foodborne illness. The statistical system, however, is not set up to measure improvements in the quality of food. That could help explain the fall in measured productivity.
Similarly, the pharmaceutical industry shows a measured productivity decline of 28% from 2009 to 2019. That’s a surprise given that it’s usually thought of as one of America’s leading innovative industries.
But that figure is not adjusted for the effectiveness of the medicines being produced. For example, it doesn’t take into account the increased number of innovative biologic medicines that are more complex to produce. In addition, the final price paid to manufacturers is often affected by ex poste rebates based on total sales and effectiveness, which are not picked by the government’s data collectors. Since the pharmaceutical price index is used to deflate industry revenues to calculate real output, any overstatement of price growth has the effect of reducing measured productivity.
Globalization and “Factoryless” Production. Some of America’s most successful manufacturers do their high-value product design and hardware and software innovation in domestic offices, while farming out much of the actual production of the physical product to factories in other countries. Because these companies have very few domestic factories, the economic statistics may assign their value-added to the wholesale sector or to the software development industry rather than the manufacturing sector (Bayard, Byrne and Smith, 2015),
For example, a company called Align Technology is a successful manufacturer of orthodontic equipment and scanners whose global revenues and employees roughly tripled between 2015 and 2019. The company is based in California, and books almost half of its revenues in the US, but all of the manufacturing is done in China, Mexico, and Israel (Align Technology, 2020). Because the company has no domestic factories, its revenues are unlikely to be assigned to the manufacturing sector by government statisticians.
Production of Goods by Nonmanufacturers. In today’s world, some manufacturing is being done by companies that are not counted as manufacturers. In particular, Google and other cloud providers have been designing and building their own servers, which are not picked up by the statistics as manufacturing output (Byrne, Corrado and Sichel, 2018).
The Increased Importance of Data Services. To a rising degree, manufacturers like John Deere and General Electric are bundling data services with their products. Tesla regularly delivers “over-the-air” software updates to its vehicles that add new features or improve existing ones. These after-the-fact gains are not counted as part of manufacturing output, but in theory they should be.
It is important to consider these issues seriously, because they show potential points of strength in manufacturing. Policymakers, however, still need to address the productivity weakness in domestic factories. In particular, as we have written elsewhere, there may be a large role for government in accelerating factory digitization.


